Making a Trade out of the Model
Part 2 of the HYHY.APP series. Why trading the gap between model and market is harder than it looks, and how anchoring the stop-loss to the model price helped.
By HYHY.APP ·
How do you turn a price into a trade?
Now that there was a price, I began to think about how I would trade it. Everything below is written as if I were buying a Yes resolution. The same applies when buying No.
To start, I made a deliberate choice to forward test only, with no backtest. At 15 minutes per cycle, iteration is fast. I could watch market behavior unfold in real time, absorb the action and reaction, and adjust the next cycle, all within the same hour. A backtest would have meant collecting proper OHLC data first, then building and validating a harness before I even got to test an idea. Forward testing let me skip straight to learning.
Why not just trade the gap?
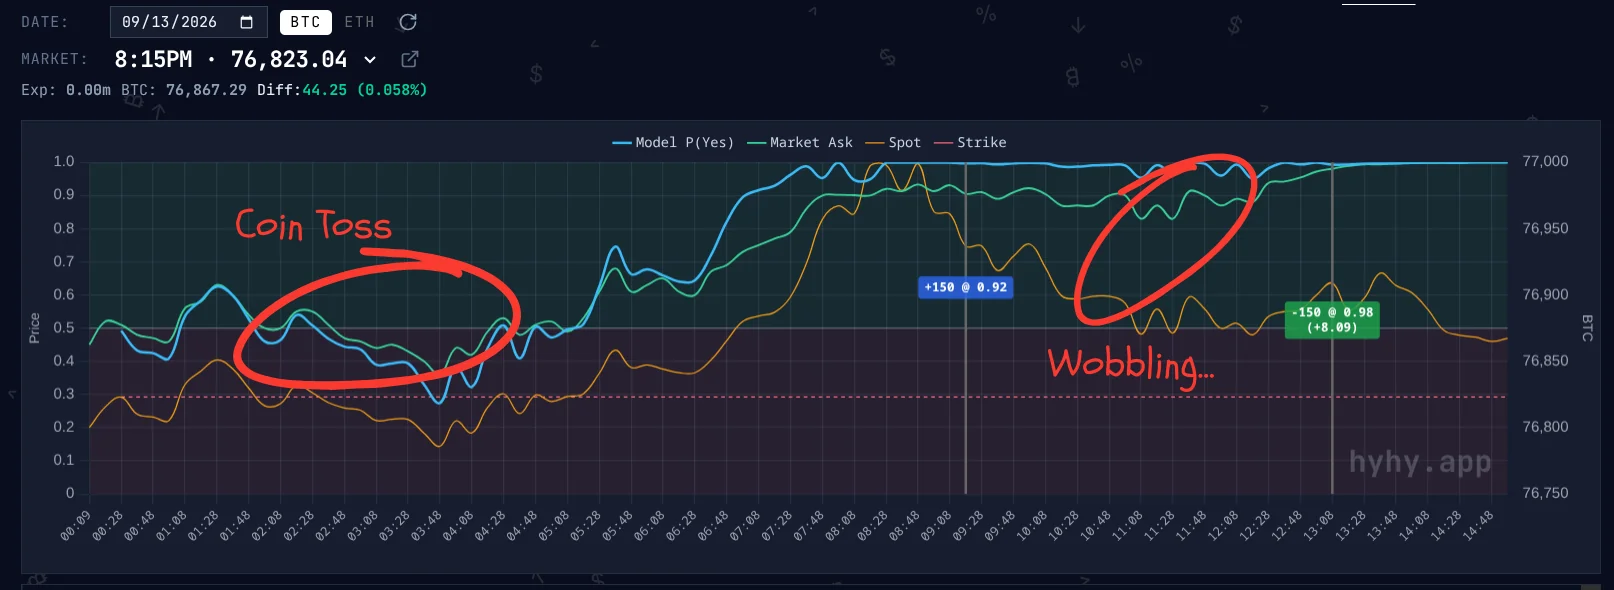
My first intuition was to trade the gap. Whenever the model led the market by 20 cents, I would go long. It quickly became apparent that this does not work when the contract is trading between 40 and 60 cents. That is basically a coin toss.
So I moved up to the 80 to 90 cent range. At that level the expected return is 1.11x to 1.25x on a $1 payout. That is reasonable, especially if I can call it with confidence. The problem was not the entry. It was everything after.
What goes wrong after entry?
Entering early to mid-market, around minutes 3 to 7, often meant long exposure while the market kept fluctuating. A 5 cent wobble was expected, but once you see a 10 cent move you start guessing.
As we near the 10 minute mark, even a short spike in BTC moves the market noticeably. A move that would have nudged the market 2 cents at minute 3 might swing it 5 to 8 cents here, because there is less time left for the price to mean-revert.
What happens past the 12 minute mark?
Past minute 12, this stops being a matter of degree and becomes a different regime entirely, especially when spot is hovering near the strike. The option is now pinned hard, and the price behaves less like a probability and more like a step function.
In the chart below, BTC sat within $6 of the strike (a 0.008% difference) around minute 13. The model whipped from 0.2 to 0.9 and back twice in under two minutes. That is the gamma trap. The same small tick gets priced almost binarily, purely because of where and when it happens.
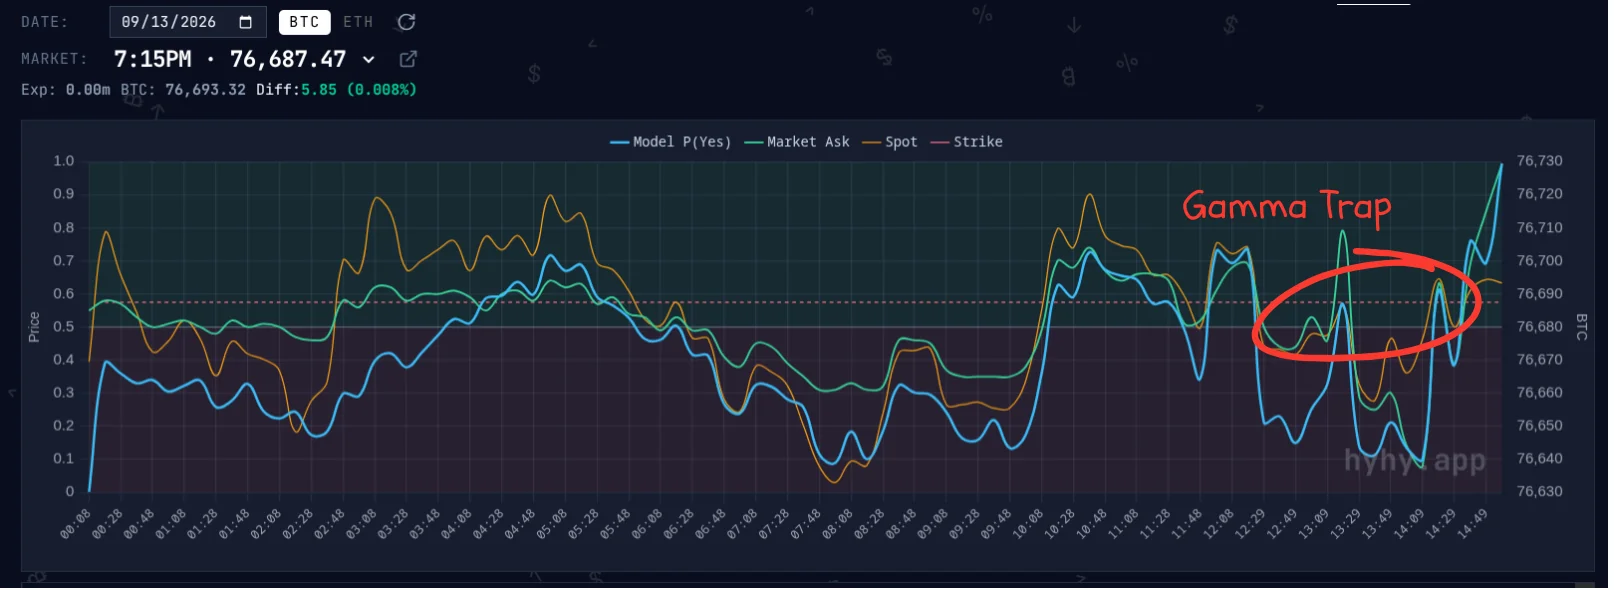
Say I entered Yes at 0.85 with the model reading 0.90 around minute 6. By minute 9, BTC ticks down and the market drifts to 0.75, while the model is still at 0.88. Is that a bad trade, or just noise before gamma amplifies it back my way at minute 12? At that stage, gut feel is a coin toss. Near expiry, it is a roller coaster.
How did I handle risk?
So yes, I spent the next two months studying risk management and stop-loss levels. It is the most cliché trading advice there is, and it is still the hardest to actually follow. Opening a position is easy. Knowing when to admit it was wrong is not.
My solution was to fall back on the thesis. The model leads the market, so I anchored my stop-loss to the model price instead of the market price. I cut the position only when the model itself falls below my entry. Otherwise the market wobble is just that, and I sit through it.
That got me through most of the false stop-outs, but not all of them.