How to use the HYHY.APP chart
A walkthrough of the HYHY.APP chart: how a volatility-based model price compares with the market, and how Flip Probability, Volume and Open Interest, and custom signals add context around the gap.
By HYHY.APP ·
Over the past few days, I've received many questions on how to use the HYHY.APP chart. Here's the thinking behind it.
The thesis
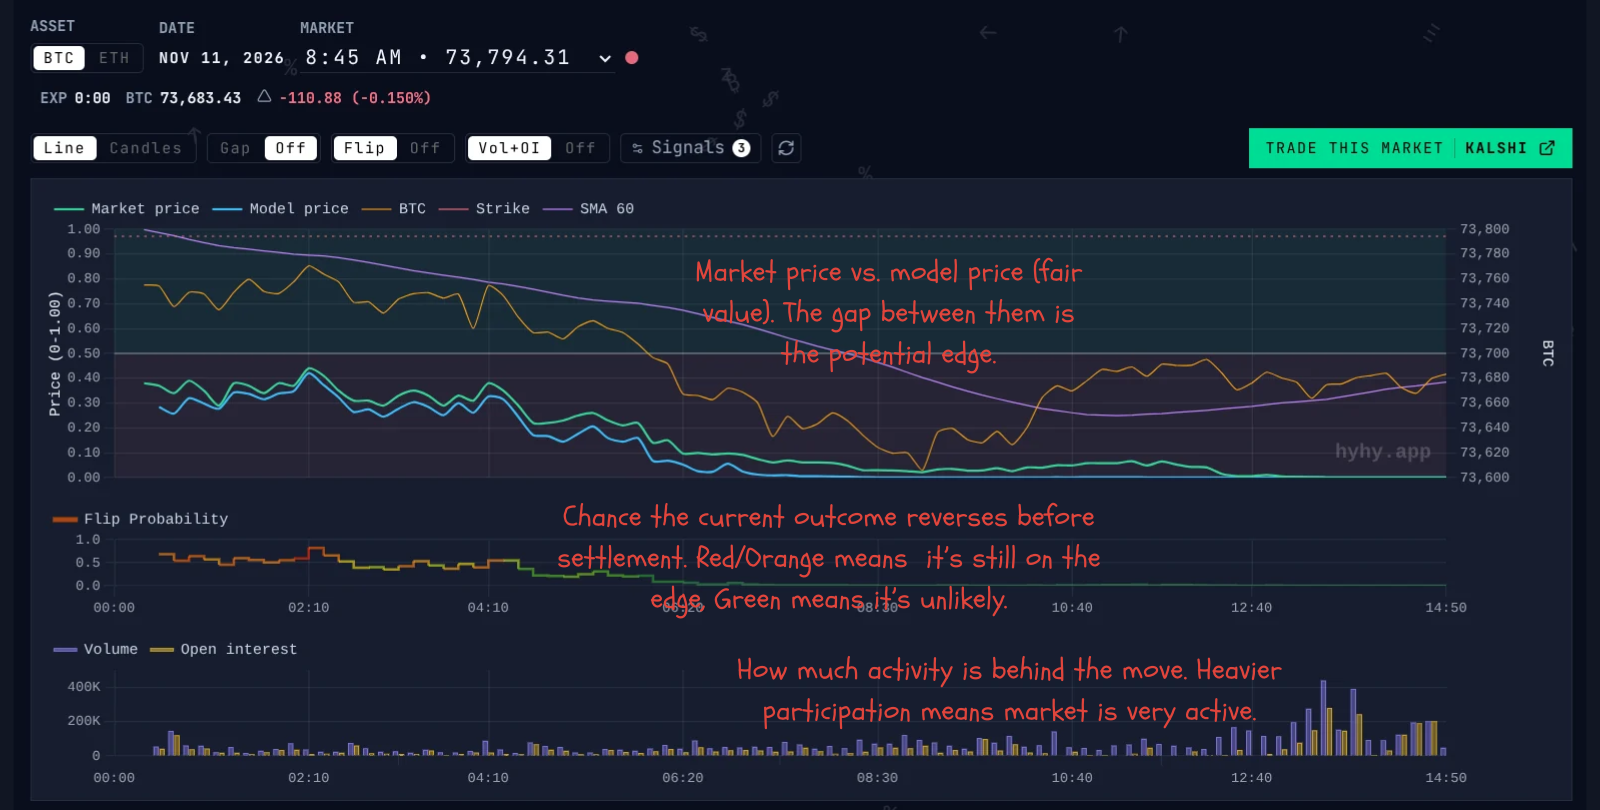
The chart is built on one idea: a vol-based pricing model gives a forward-looking fair price, which we can compare against what the market is trading.
Say the market is trading Yes at 0.85 and the model prices Yes at 0.95. In theory, that's a 10-cent edge. If the model is right, buying at 0.85 earns about 10 cents per contract on average, before fees.
Why you shouldn't trade the gap blindly
A theoretical edge isn't automatically a good trade. That's why the chart includes a few tools to give you more context around the gap:
- Spot, Target and SMA. These show how far (and how safe) the current spot price is from the target, with the 60-period SMA adding trend context.
- Flip Probability. A separate step chart estimating how likely the current outcome is to reverse before the market settles. Orange/red means a flip is likely and the outcome is still up for grabs. Green means the outcome looks settled.
- Volume and Open Interest. Shows how much participation sits behind a price move. A divergence on thin volume may be less reliable than one backed by heavy activity, and a late surge in volume and open interest often signals positioning ahead of settlement.
Define your own signals
Beyond the built-in panels, the chart also lets you configure custom signals, so you can quickly spot the scenarios you care about. Each signal is a rule: give it a label, pick the conditions that matter to you (such as market price, model price, or distance from the target), choose how those conditions combine, and assign an annotation color. When a market meets your rule, the chart marks the first matching tick, so you can see at a glance where your scenario occurred instead of watching every market yourself. Your rules are saved to your account.
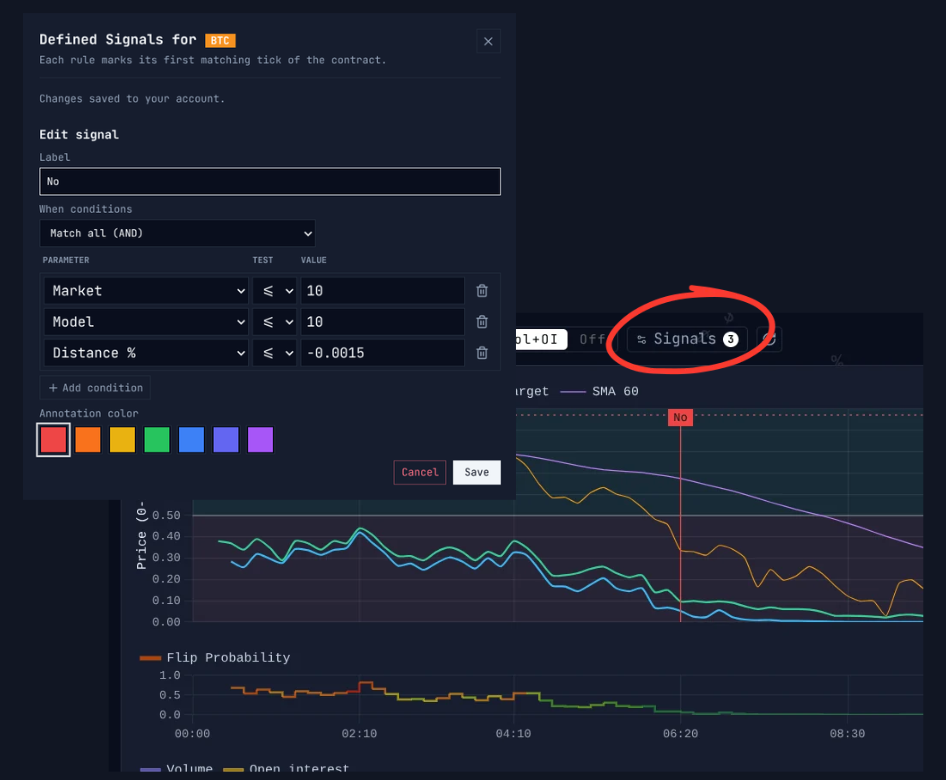
For example, a signal labeled "No" could match when both the market price and the model price are low and spot sits a set distance from the target. You define what counts as a scenario worth noticing. The chart only flags when it happens.
Putting it together
The three tools answer different questions. The model price asks what is this worth? Flip Probability asks how settled is the outcome? Volume and Open Interest ask how much activity is behind this? The chart puts all three in one view so you can form your own read of the market.
What people use it for
Different users look at the same chart for different reasons:
- Entering a position. Some users look for a gap between the model and the market, then check spot against the target, Flip Probability, and volume to see how much context supports it.
- Fading the market. Others use the same information to question a market they think is mispriced, for example when the price is aggressive but Flip Probability still shows the outcome is open.
- Holding. Once in a position, users can follow the chart as it updates to see whether the model, the market, and spot are moving together or apart.
- Taking profit or cutting a loss. Users can watch whether the gap has closed, whether Flip Probability has shifted, or whether spot is moving toward the target, and weigh that against their own plan.
None of these is a recommendation. They're examples of what the chart makes visible.
Things to keep in mind
- The model is an estimate. It can be wrong, and a gap between model and market is not a guarantee of profit.
- No single tool tells the whole story, so it helps to read them together.
- Two people can look at the same chart and reach different conclusions, and that's expected.
HYHY.APP is a tool for seeing the market more clearly. It doesn't provide trading signals or advice, and every decision to enter, fade, hold, or exit is yours.